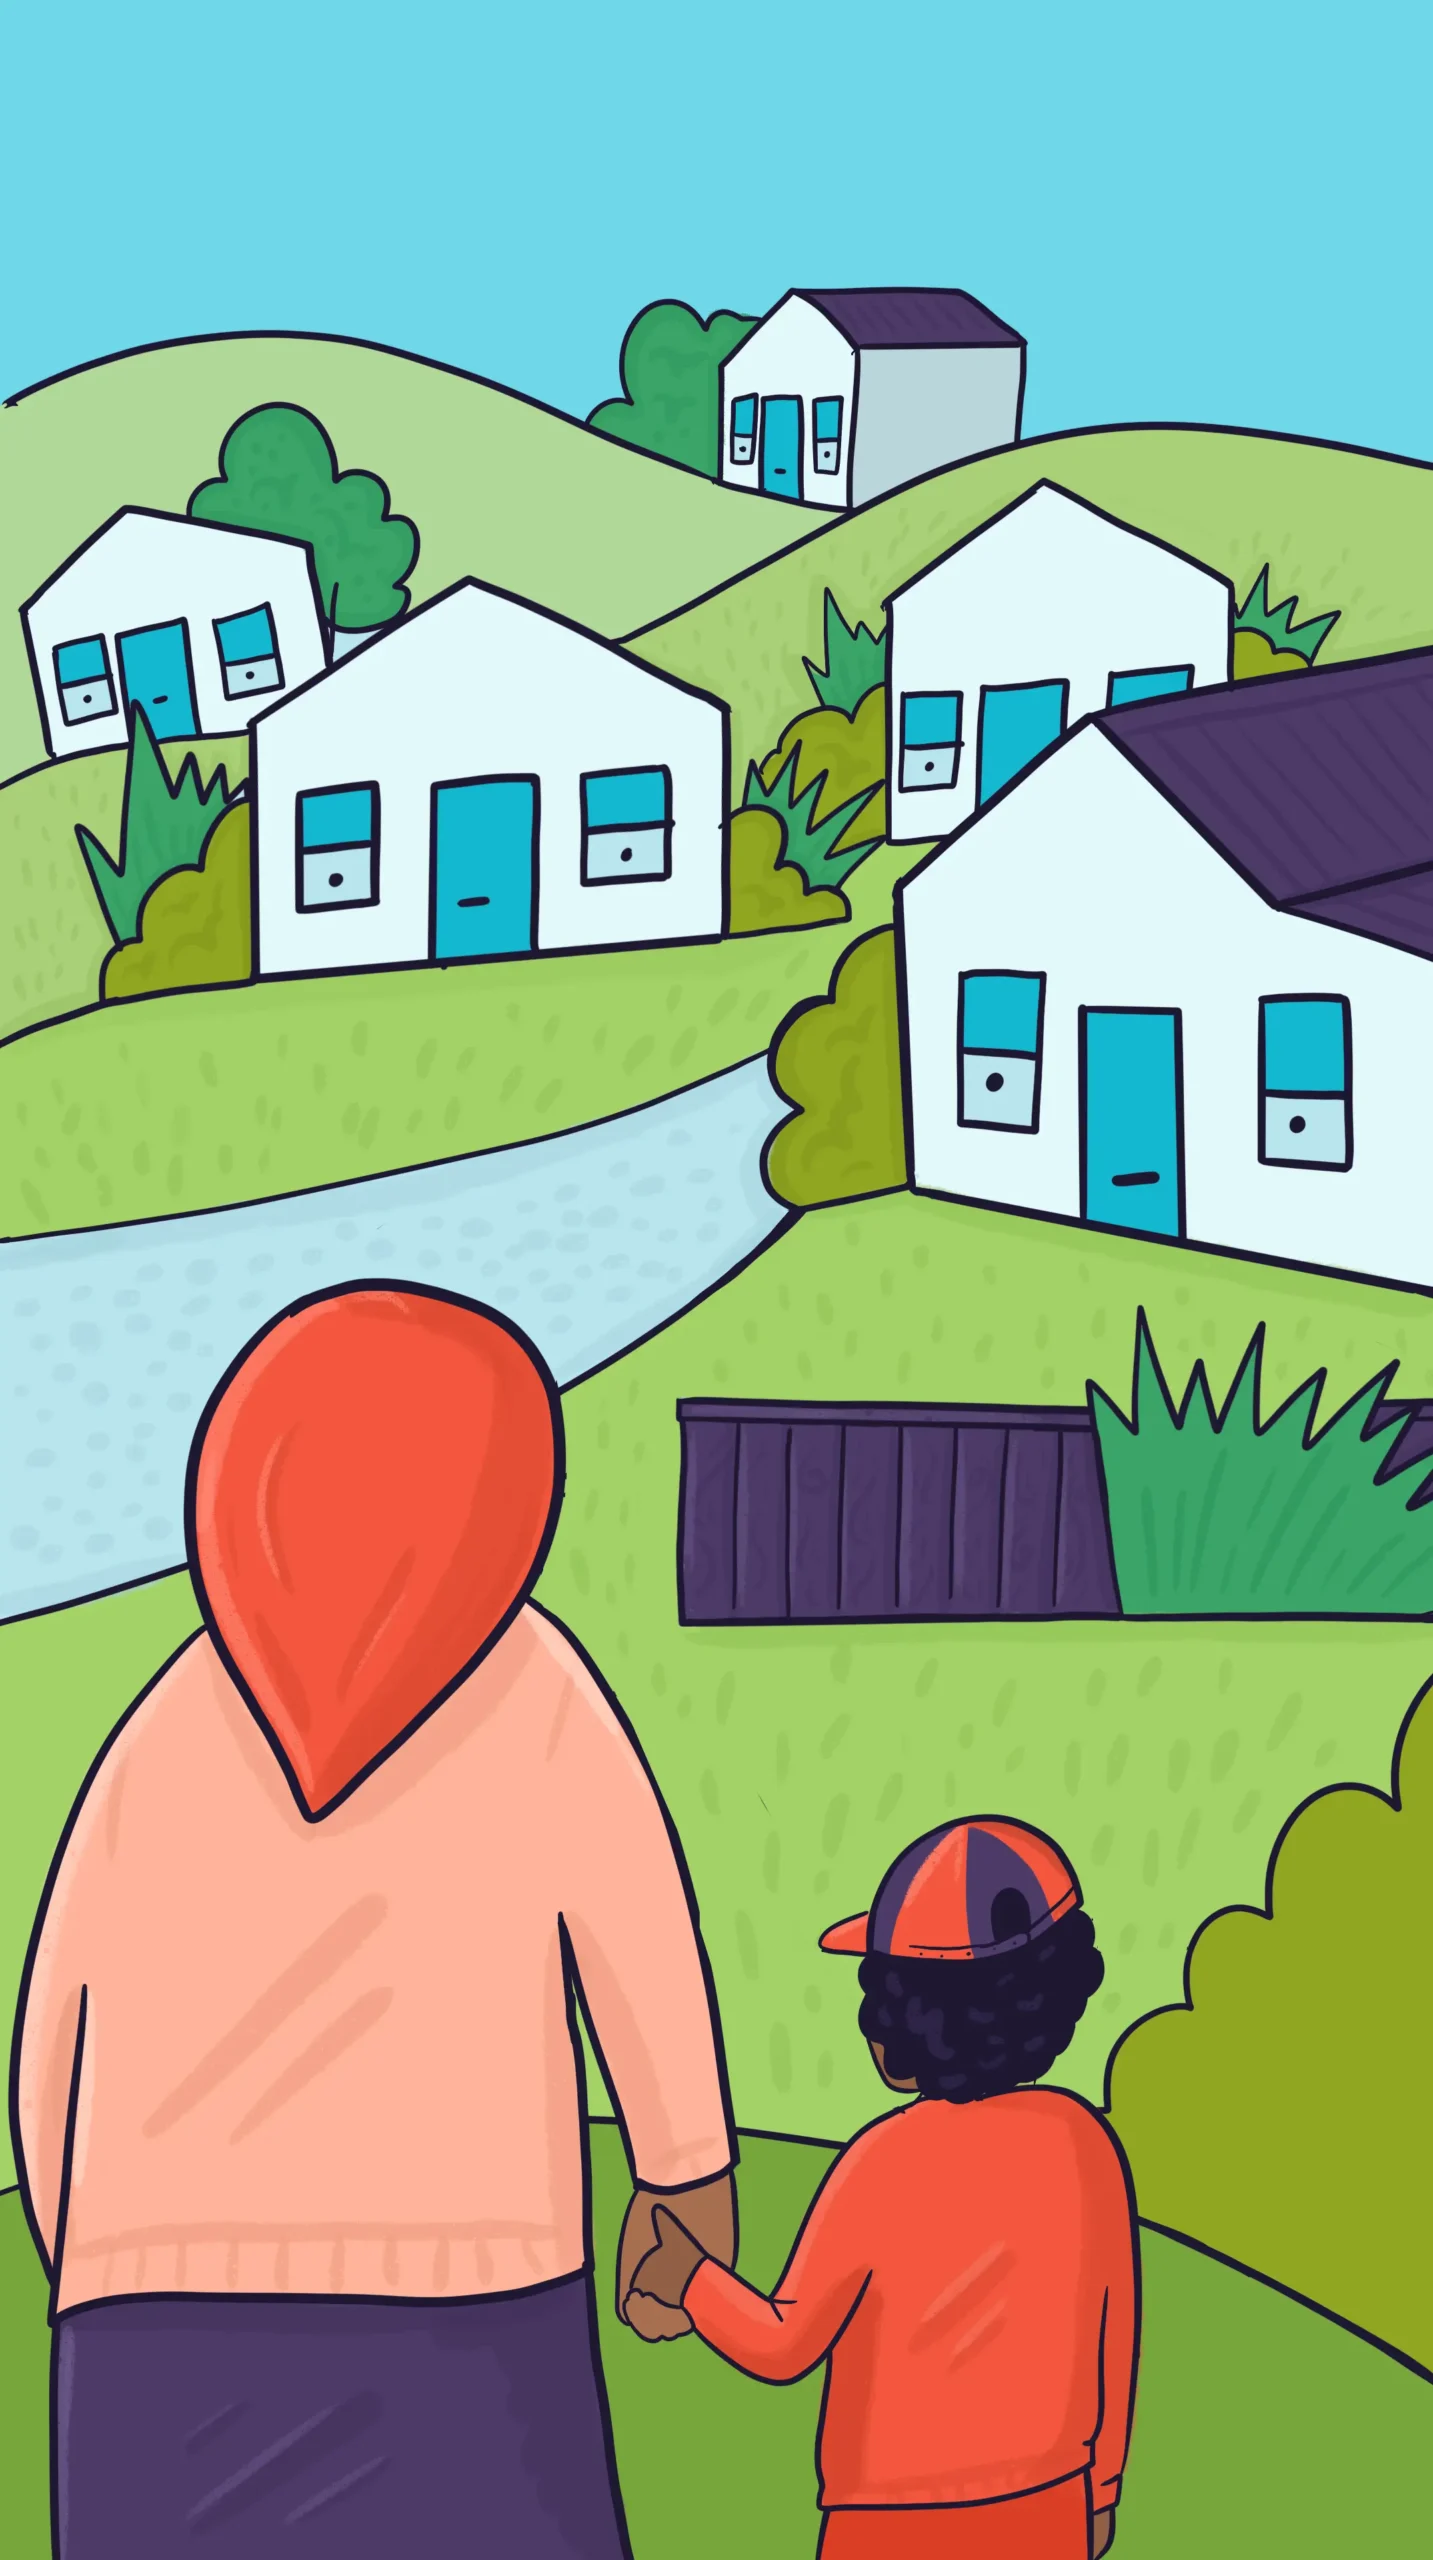
1. What is the Whaitua Mapping Tool?
An online mapping platform designed to visualise detailed information about local communities across Aotearoa. It highlights critical social and economic determinants of health such as healthcare access, housing quality, environmental conditions, and availability of services like vape shops, liquor outlets, and fast-food stores.
2. Who developed the Whaitua Tool?
Āti Awa Toa Hauora Iwi Māori Partnership in collaboration with Te Tāhu Hauora (Health Quality & Safety Commission), and with early input from Te Karu o Te Ika Poari Hauora IMPB.
3. Who else supports the Whaitua Tool?
Whaitua is presented with the collaboration and support of all 17 IMPBs across Aotearoa, whose communities and iwi will be able to use the data within to tell their own stories. It has also received support from mana whenua iwi including Te Āti Awa ki te Upoko a Māui, Āti Awa ki Whakarongotai, and Ngāti Toa Rangatira and from local and national health and social service agencies committed to improving community wellbeing.
4. What is Whaitua designed to do?
Empower whānau, hapū, iwi, and local communities by providing precise, accessible, and localised data. This supports community-led advocacy, better-informed policy decisions, and initiatives aimed at improving health, wellbeing, and living conditions.
5. Who can use this tool?
The tool is freely accessible to whānau, hapū, iwi, community groups, kura, policymakers, and anyone interested in understanding and addressing community wellbeing and health disparities.
6. What data does the Whaitua Tool provide?
The tool offers detailed point data (such as the locations of GPs, hospitals, schools, fast food outlets, vape shops, and liquor stores) and community-level data (including housing quality, income, employment, demographic composition, disability prevalence, vehicle access, internet connectivity, and more).

7. How detailed is the data?
Data is available down to the Statistical Area 2 (SA2) level, typically representing communities of approximately 1,000 to 4,000 residents. Users can explore data across entire rohe, individual districts (whaitua), or specific neighbourhoods.
8. What is the "Monitoring our Oranga" Framework?
Launched alongside Whaitua, Monitoring our Oranga is a Kaupapa Māori framework which sets out how Āti Awa Toa Hauora Partnership Board intends to carry out its monitoring responsibilities to uplift oranga in our rohe. Using uniquely Māori processes, it reclaims how oranga is defined and measured. It upholds the principles of tino rangatiratanga, indigenous rights, and Te Tiriti o Waitangi and is designed to guide collective learning, monitoring, and advocacy efforts within Māori communities.
9. Can I compare communities using the tool?
Yes. Users can compare community-level factors within a rohe or across multiple IMPB areas. There is also a dual-map feature enabling exploration of correlations between different factors, such as housing quality.
10. How can communities use this information?
Communities can use Whaitua data to tell their own stories, advocate for targeted policy changes, and effectively highlight areas of concern or excellence. It supports stronger community voice and evidence-based initiatives.
11. How do I access Whaitua and the Monitoring our Oranga Framework?
Both resources are available online:
12. Can I create presentations using this tool?
Yes. Whaitua includes a Story Builder feature that allows users to compile sequences of maps, add commentary, and export as a PowerPoint presentation for easy sharing and advocacy.
13. Who can I contact for support or more information?
The landing page of the tool has a link you can use if you have any questions on how to use the tool or how to interpret the data. We also welcome your feedback on the tool.